Lab · Open-data check · September 2026
Under Giza with open data
In three lines
The first stage of their method, measuring tiny movements from a satellite, is real and works where things move by millimetres. The second stage, turning those movements into a section of the underground, does not survive the tests: the structures stay just as sharp after the information they should come from has been destroyed, they appear identically on bare sand, and the vertical axis is not a measured depth but a hand-chosen scale. I got here hoping to find the opposite, and I say it with no grudge against the people who opened this road.
What they say
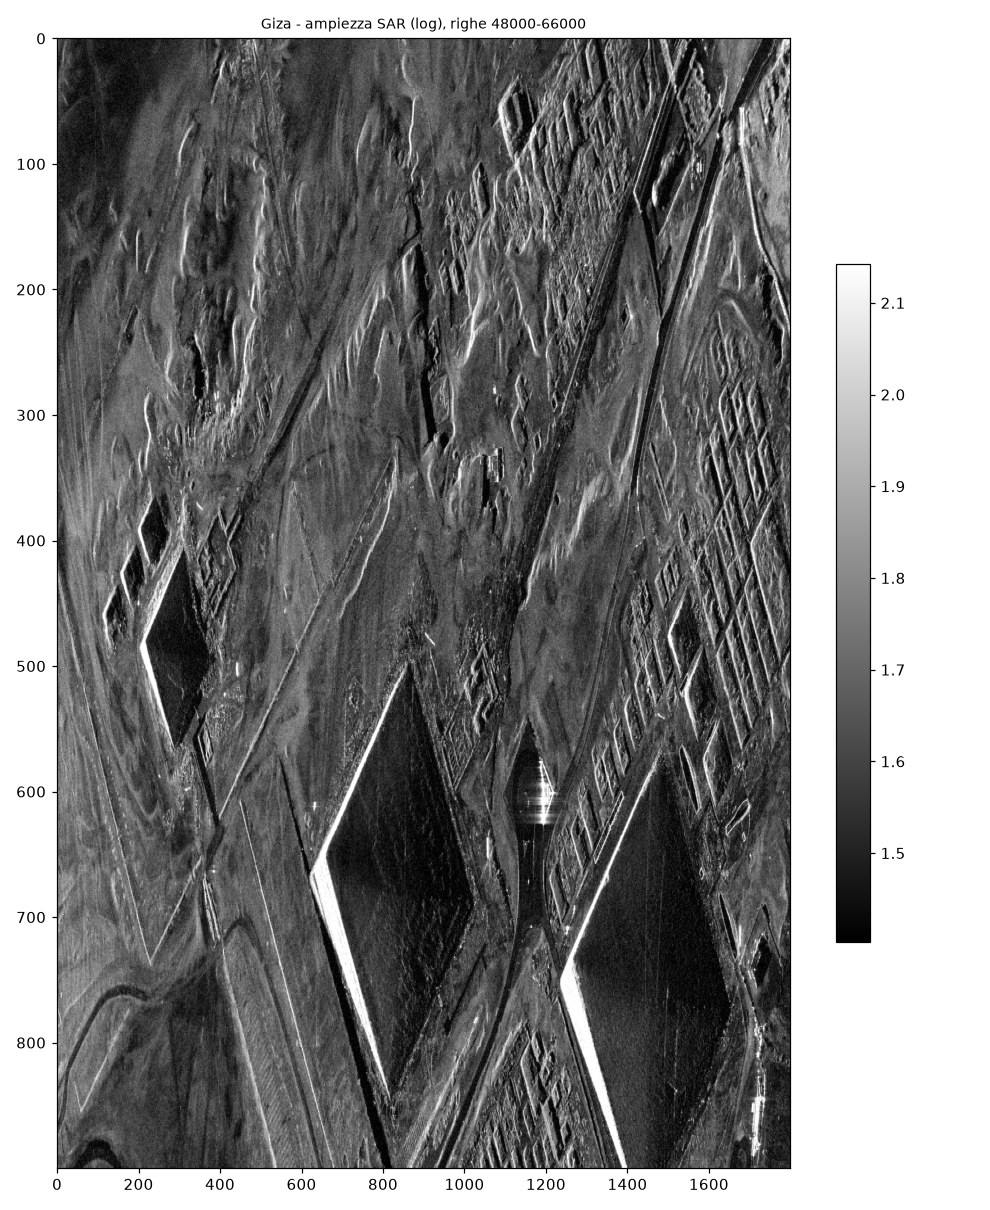
In 2022 Filippo Biondi and Corrado Malanga published in Remote Sensing a method they call SAR Doppler tomography. The idea: the Earth's surface vibrates all the time, the satellite radar can measure those tiny vibrations, and the vibrations carry information about what lies beneath. Since 2025 the Khafre Project has shown the public eight shafts said to descend 648 metres below the pyramid of Khafre, down to two cubic chambers 80 metres on a side. The official statement of the 16 March 2025 conference says the data are public, "provided as open-source by Capella Space and Umbra".
The 2022 paper was retracted by the journal on 10 August 2026 with a five-line notice that does not go into the substance. Biondi is right to protest that, and the twin paper on Vesuvius, same method, same journal, is still in place. The retraction is not an argument. The maths is.
The data I used
| Source | Scenes | Content | Size |
|---|---|---|---|
| Capella Space open data | 16 September and 4 October 2024 | X-band spotlight, 32.9 s of integration, 4.5 cm azimuth resolution. The only two scenes in the Capella catalogue that contain the plateau. | 6.4 GB |
| Umbra open data | 7, 8, 10 February and 8 March 2023 | Folder "Pyramids of Giza". Two collects on Khufu and two on Khafre, with raw pulse-by-pulse data for two of them. | 2.6 GB |
| Umbra, Mosul Dam | 8 August 2023 | The "proof of concept" Biondi shows at conferences: the dam with its turbines. Image and raw data. | 5.2 GB |
These are the data their statement names as its source. I do not have the COSMO-SkyMed images of the 2022 paper, which the Italian Space Agency provides on request and which the paper lists as "not applicable" under data availability. Anyone can download what I downloaded: the commands are in the code.
Their method, put simply
The satellite passes over the plateau for about thirty seconds and images it many times as it goes, like the frames of a film. Every point of the pyramid is seen in each frame, and from how it changes from one frame to the next you get how much it moved. So far this is known technique, micro-motion from Doppler sub-apertures, and Biondi has applied it successfully to ships, bridges and dams. Their method then takes the sequence of measurements at each point and turns it, with a Fourier transform, into a vertical profile they call depth. That second step is what I tested. One clarification: the paper does not say whether the inversion works on the phase or on the modulus of the measurements; at Spoleto Biondi says the maps are "the representation of the modulus". Every figure and number on this page is computed from the modulus, as they describe. The phase version, which I did first and which gives blobs instead of columns, leads to the same conclusions and sits in the report as a check.
Test 1 · shuffling the order
If depth comes from the sequence of frames, then shuffling the frames at random must make depth unreadable: the information was in the order, and I destroyed it. I did exactly that, on the same pixels of the Great Pyramid, ten times with ten different shuffles.
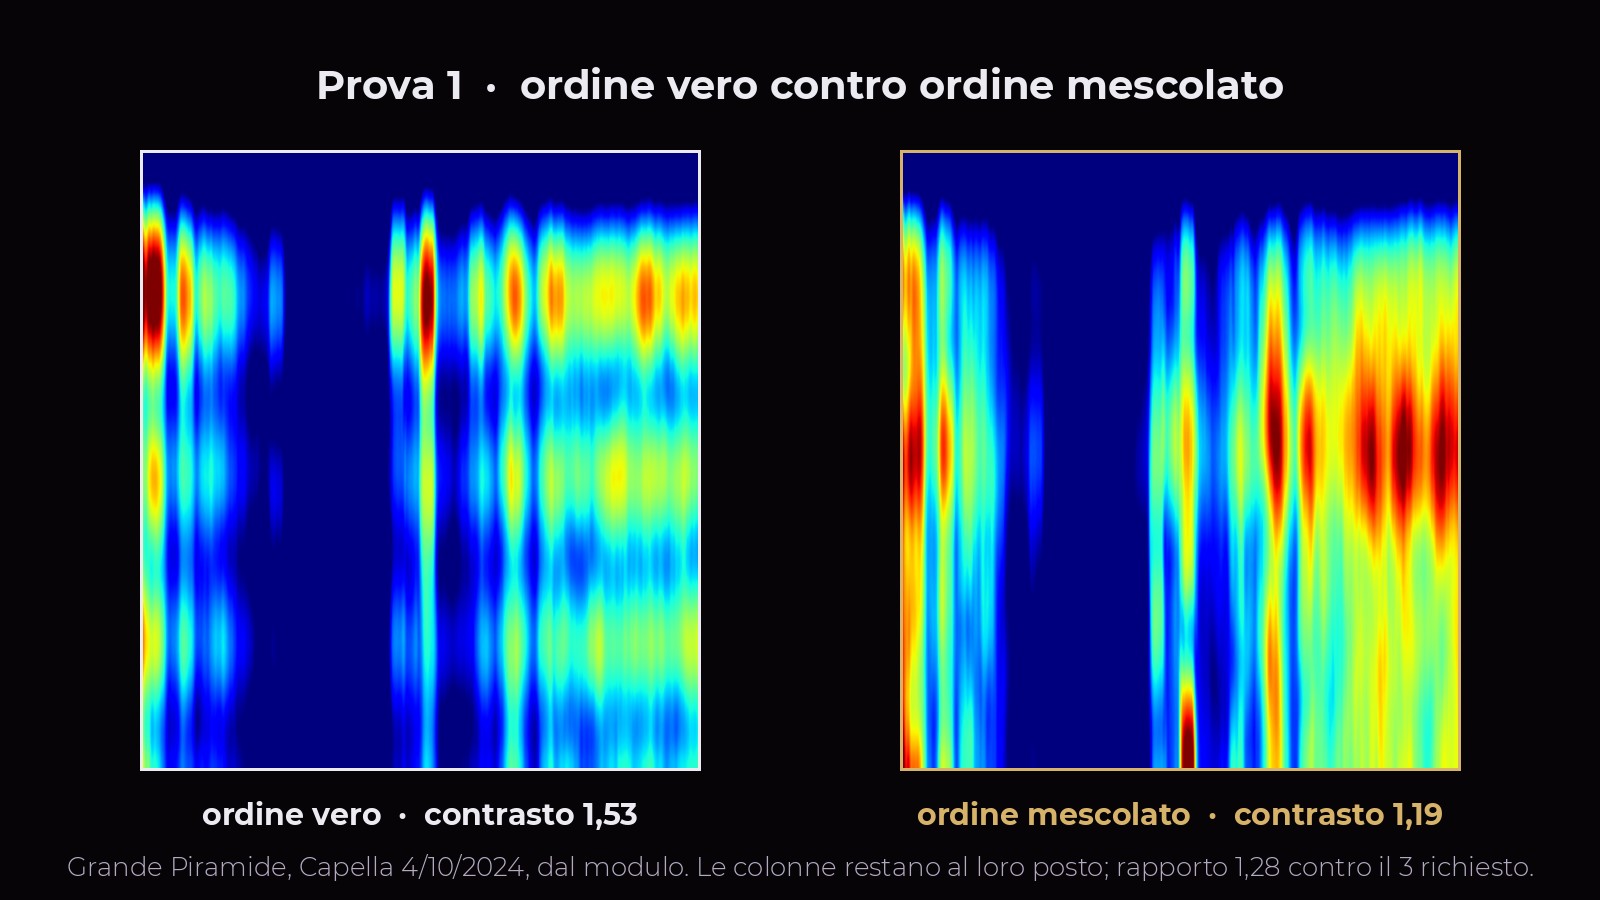
The number that matters is the contrast, how much the "pillars" stand out from the background. With the true order it is 1.529, with the shuffled order 1.192. To claim a signal the usual criterion asks the true one to beat the shuffled one by at least three times. Here the ratio is 1.28; on the second Capella scene 1.31; on the Umbra data 1.24. And the columns do not move when the temporal order is destroyed, correlation 0.86: because they do not come from the temporal order, they come from the brightness of the radar image, with which the tomogram energy correlates at 0.89. At Mosul a natural hill with no known structure gives a ratio of 1.26: the same as the pyramid. And the pyramid of Khafre, the one of the Khafre Project, gives the same result as the Great Pyramid: ratio 1.26 on the Capella scene, 1.09 on the Umbra scene of 8 March 2023 pointed at it.
Test 2 · the sand
I looked for the flattest, emptiest patch in the scene, sand five kilometres from the monuments, and ran the very same procedure on it.
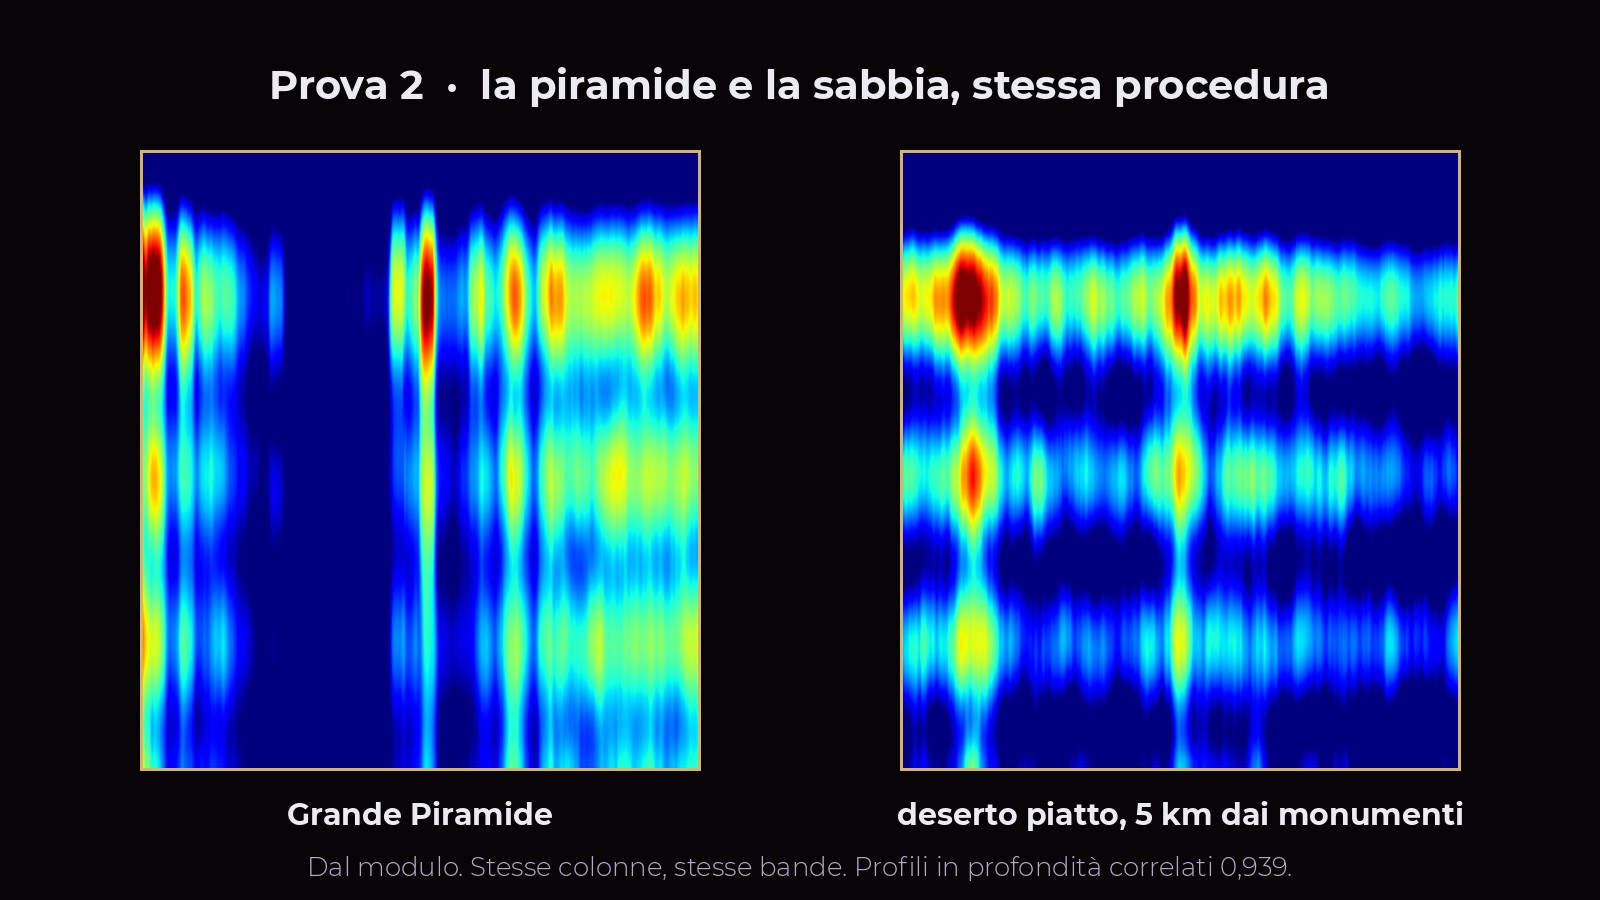
The same goes for repeatability, the argument they bring as proof of solidity. The two Capella scenes, taken from different angles, give the same depth profile on the pyramid, correlation 0.9992. But the desert gives the same profile as the second scene, 0.931: that profile repeats because it is the shape of the transform, not of the pyramid. And the pixels above the King's Chamber and the Grand Gallery cannot be told apart from those above solid masonry: difference equal to the random scatter, ratio 0.99.
Test 3 · the raw data
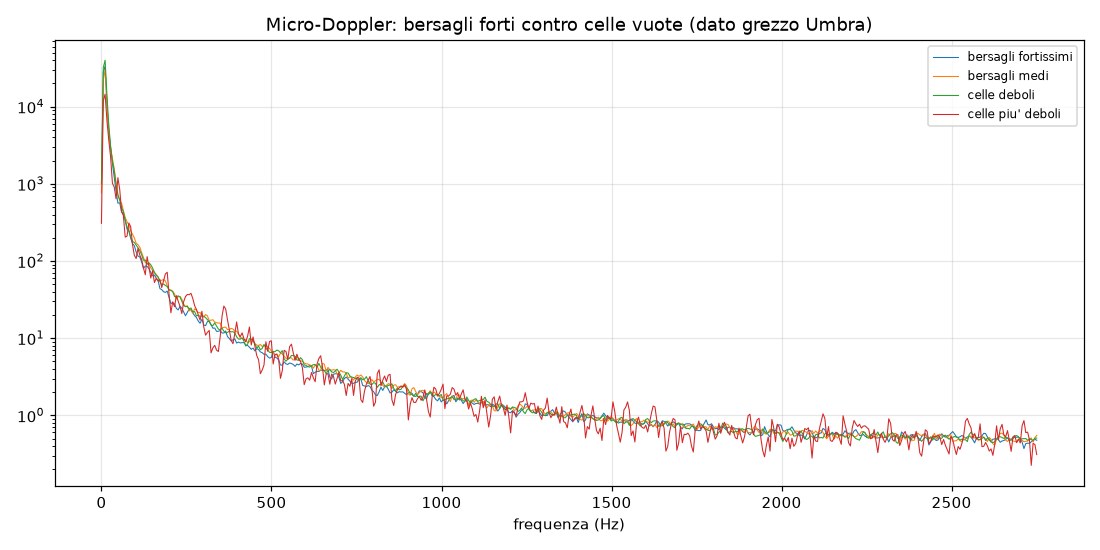
With the Umbra data I could go down to the lowest level, the pulse-by-pulse recording, with no intermediate processing and vibrations visible up to 2,741 times per second. I compared the spectrum of the cells where the radar receives the most with cells receiving seven hundred times less.
Test 4 · a noise that knows only two things
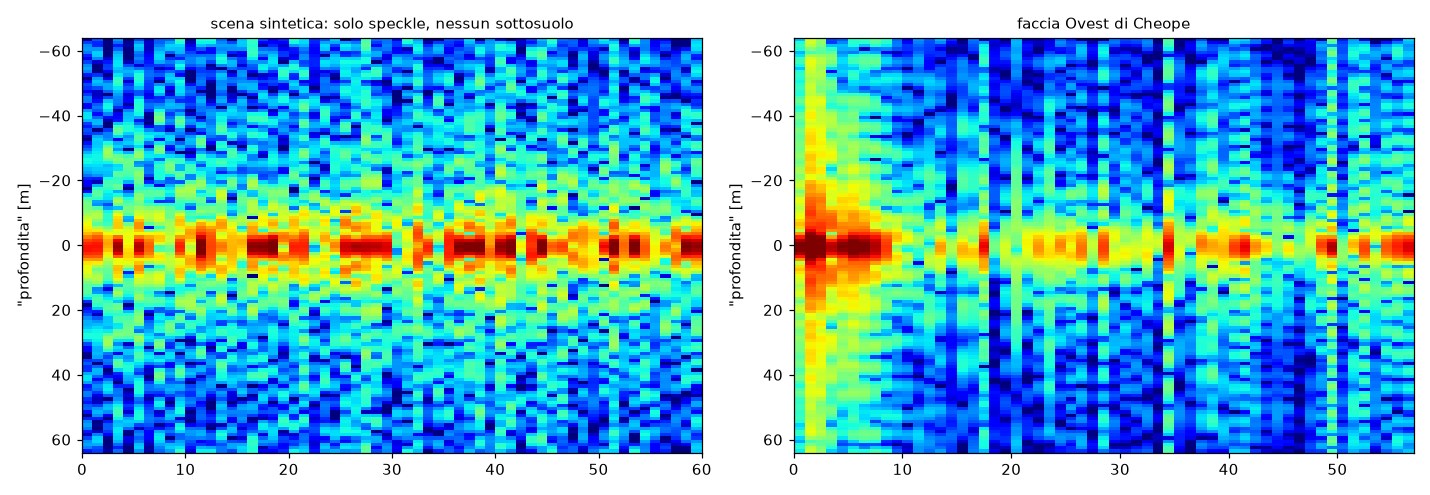
If columns and bands come from the computation and not from the subsurface, it must be possible to reproduce them with no subsurface at all. I built on the computer a radar image of pure random noise, giving it only two properties of the real scene: the surface brightness point by point, and the shape of the radar spectrum, that is how the signal is distributed along the flight direction. No phase, no structure, nothing underneath. Then I ran it through the very same chain.
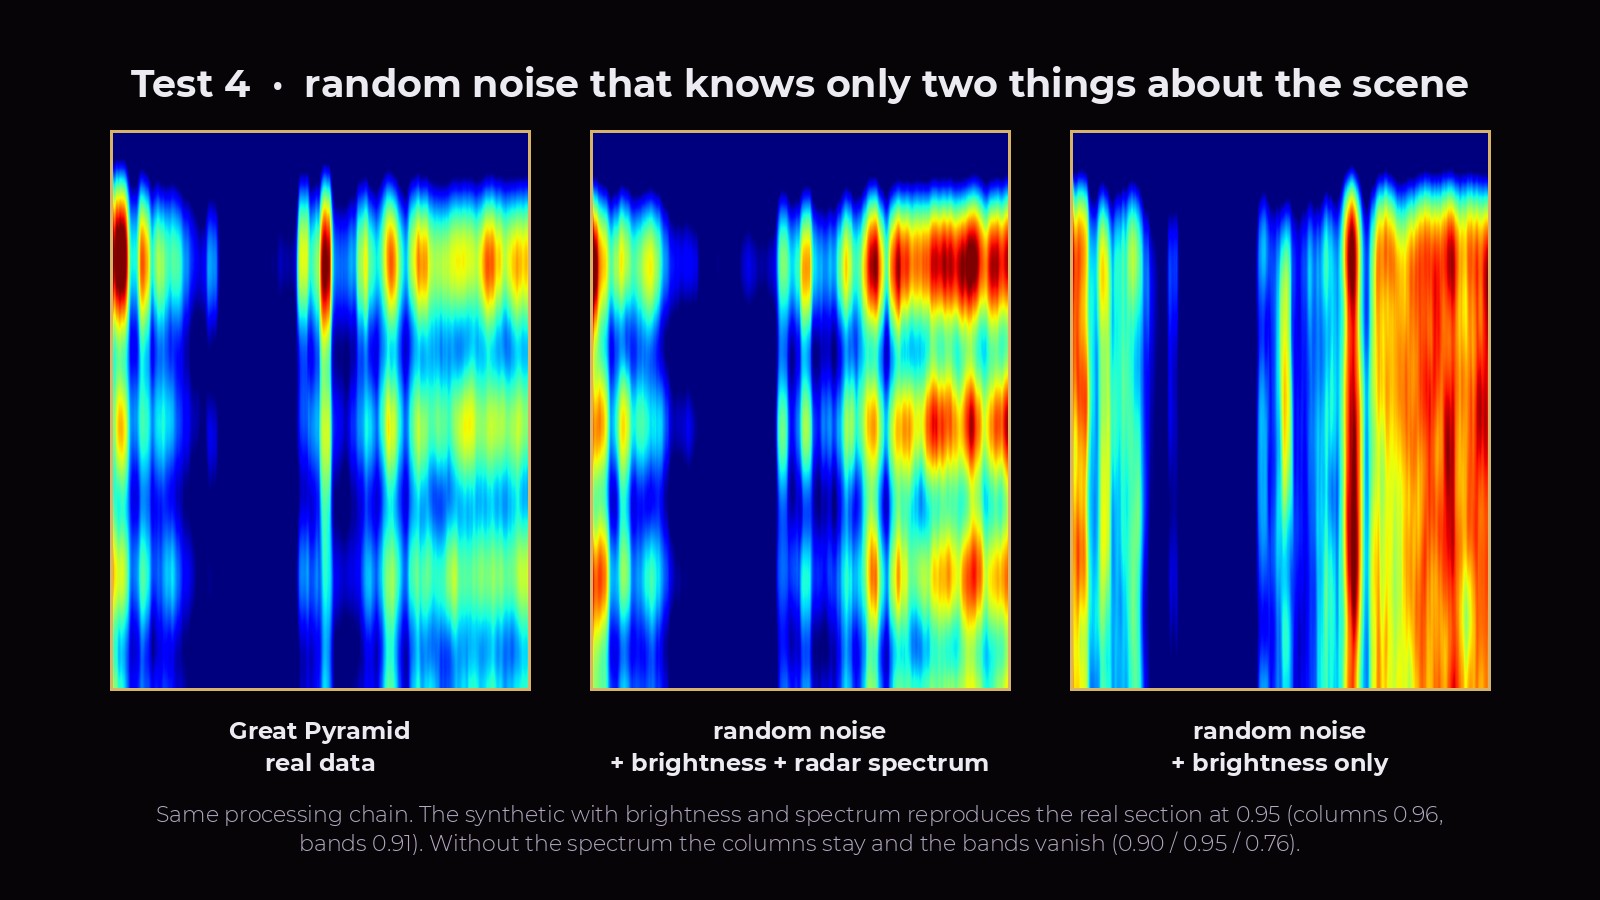
The synthetic reproduces the real section with a correlation of 0.95 over the whole image (0.96 on the columns, 0.91 on the depth profile). Remove the spectral shape and the columns stay (0.95) while the bands fall (0.76). So the columns are the surface brightness smeared along the vertical axis, and the horizontal bands are the transform of the radar spectral shape, identical at every point of the scene: that is why they appear at the same heights on the pyramid, on the sand, on Khafre and on two different scenes. Script 84.
The blue
At conferences the colour key is this: red means high vibration, blue means low, and inside a tunnel there is air, air does not vibrate, so blue is void. I checked what the energy of their tomograms actually follows; by their own description these maps are "the representation of the modulus".
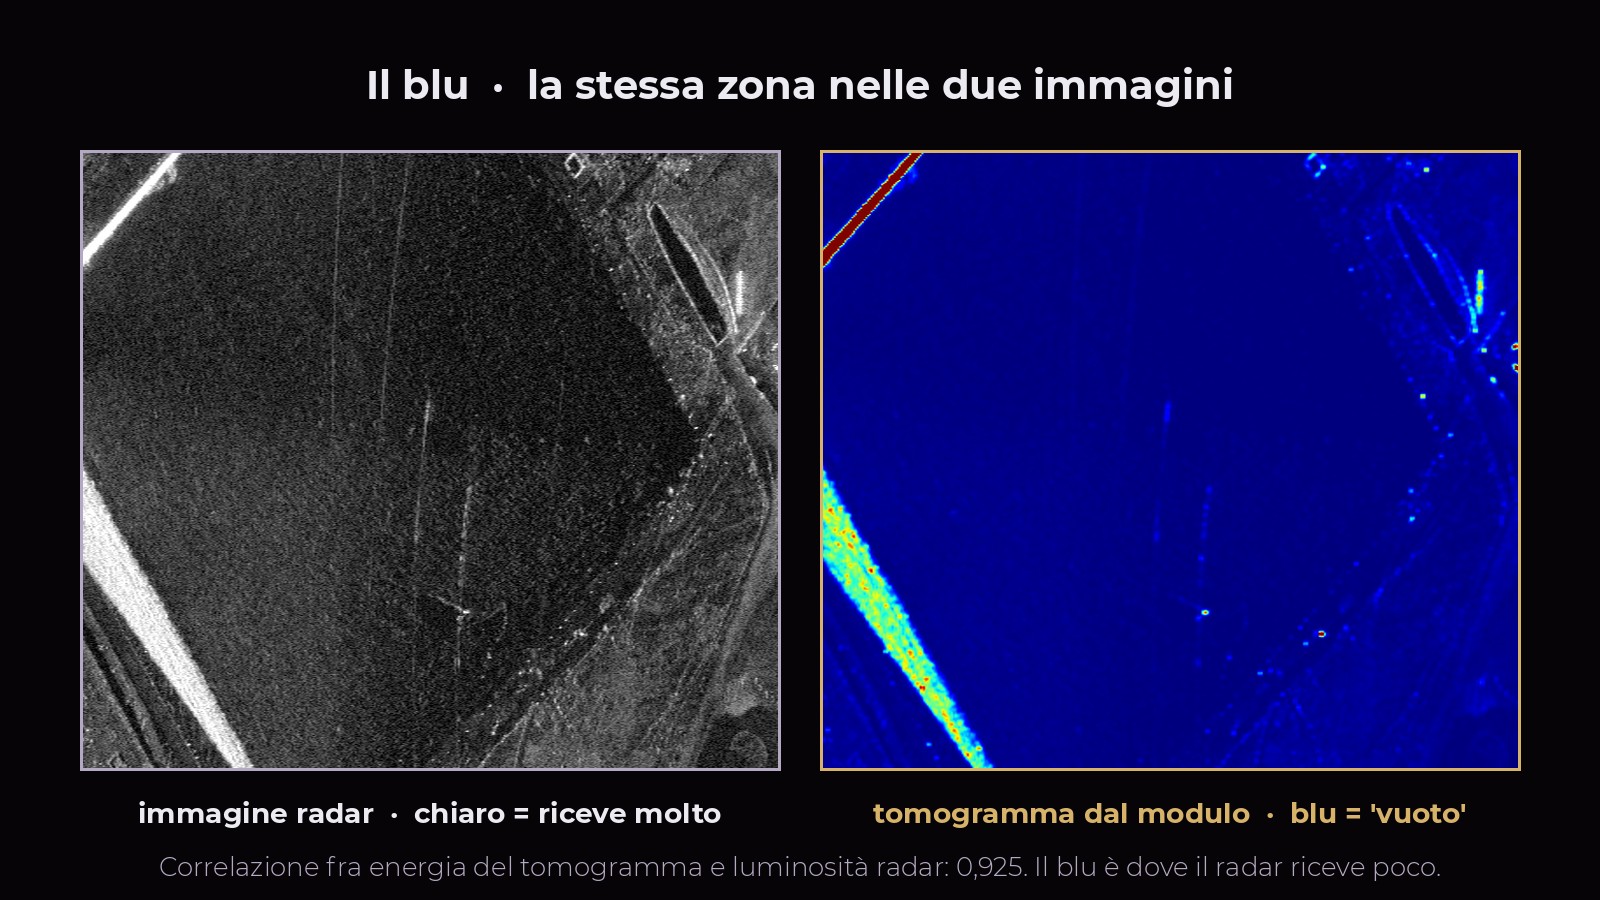
The correlation between the energy of the modulus tomogram and the brightness of the radar image is 0.925. Blue is where the radar receives little: a shadow, a smooth face, water. A pyramid in shadow is blue from top to bottom. The red columns running the whole height are bright points of the surface, an edge, a block, a corner, smeared along the axis.
Depth
In the paper the depth resolution comes from a formula containing the speed of sound in the rock and an "investigation frequency". Neither number comes from the data: the frequency is "set by us at 12,500 Hz", the speed is that of granite, 6,000 metres per second. On stage Malanga says it in his own words: "let us assume, we don't know, that this stuff is granite".
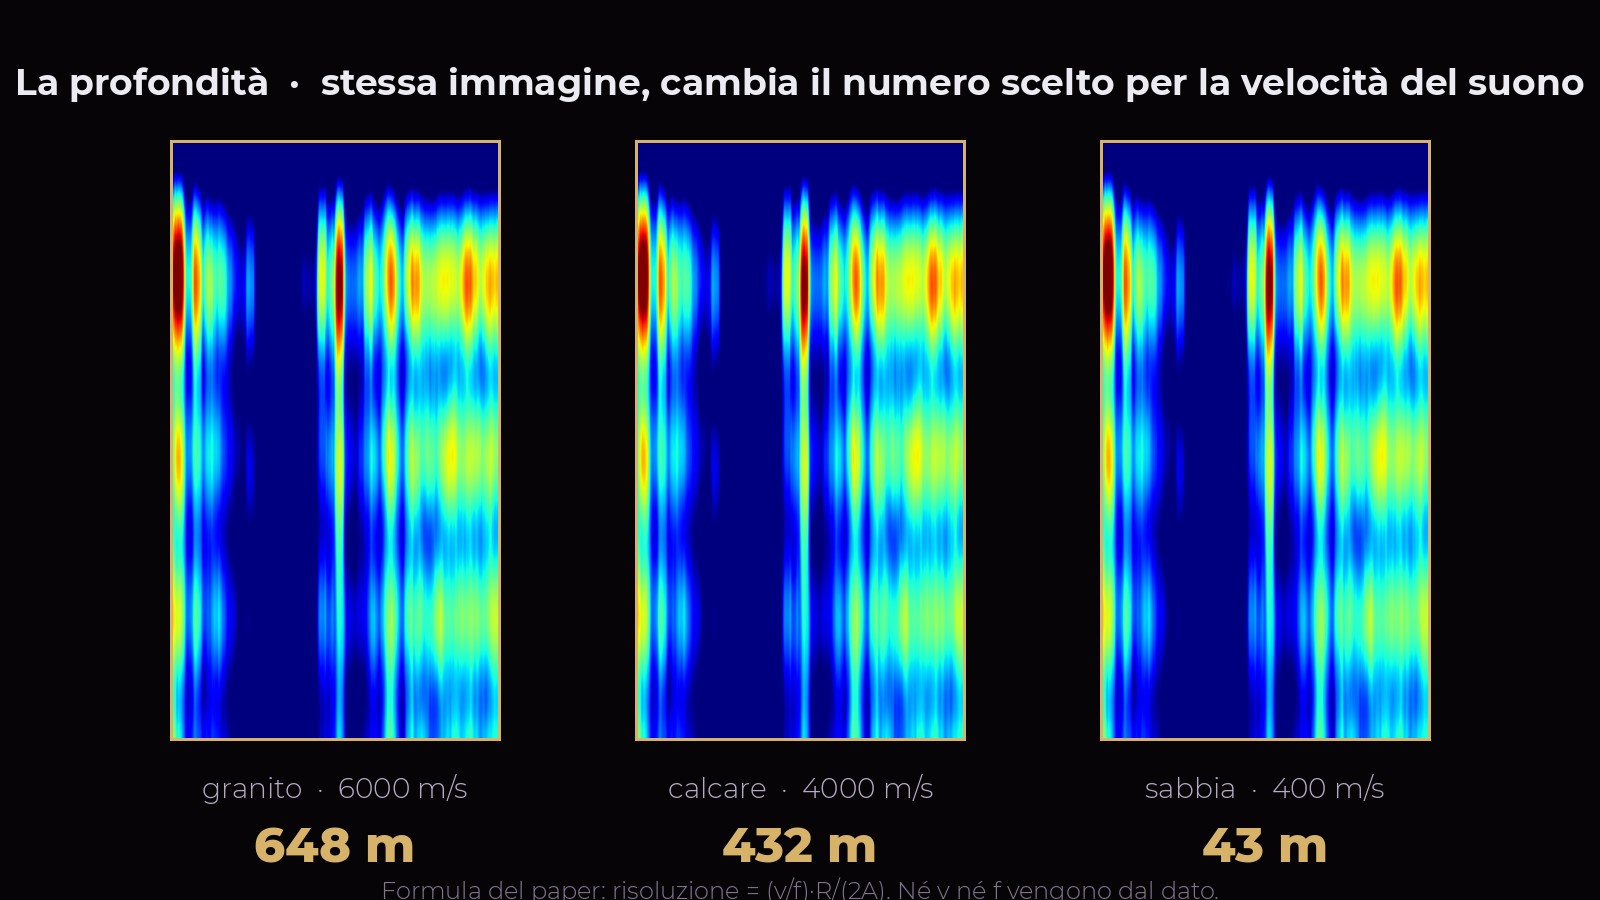
With the limestone of the plateau instead of granite, the bottom of the shafts moves from 648 to 432 metres; with fractured limestone to 270; with water to 162; with sand to 43. Changing only the frequency takes you from 432 metres to 180 kilometres. It is the same reason the same code finds a magma chamber 3 km under Vesuvius and corridors 100 m inside the pyramid. And why the tomograms come out "perfect" on the Gran Sasso and on the Mosul dam: the position of the tunnel was known, and the scale is adjusted until it fits.
How much it shakes, how much it senses
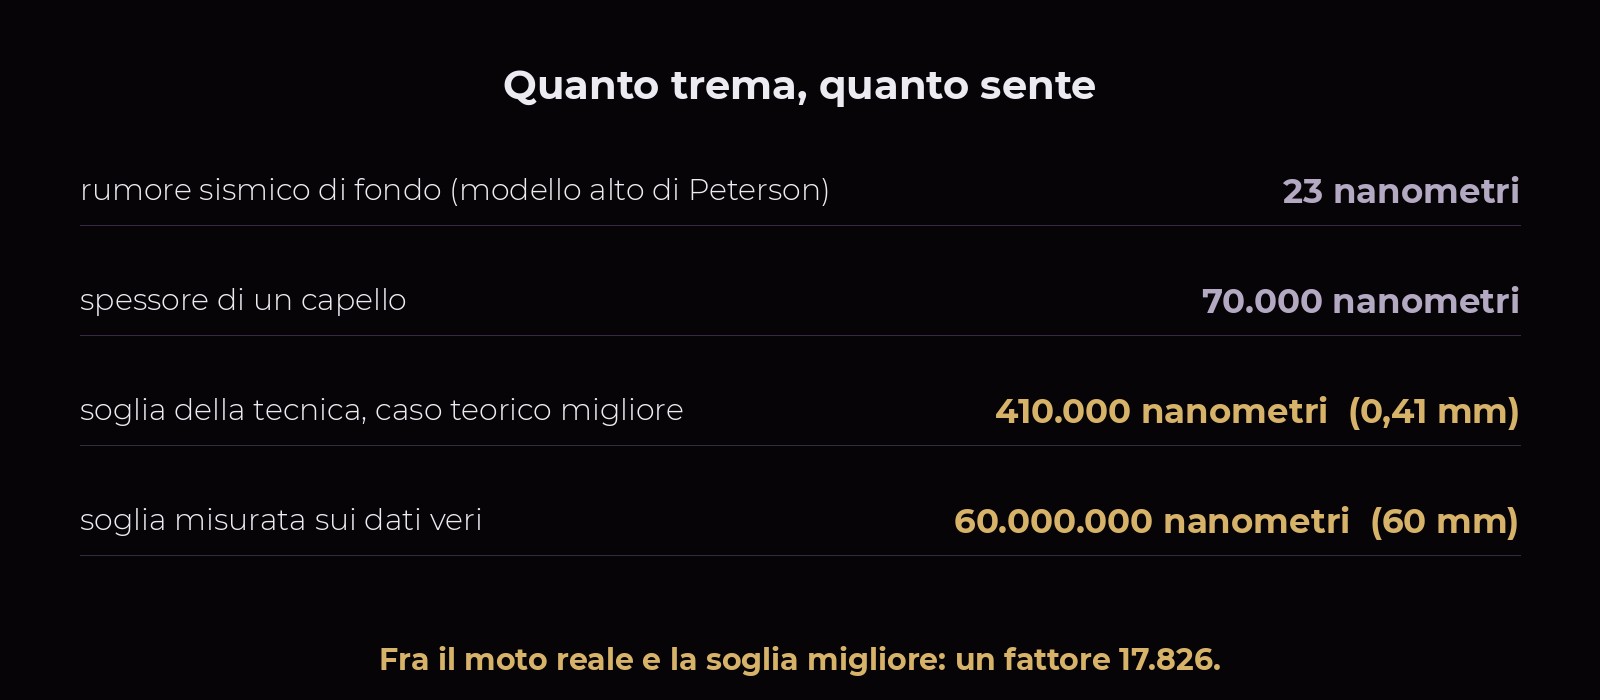
Background seismic noise, what makes everything on the crust tremble, moves rock by about 23 nanometres: that is Peterson's high-noise model, the generous one. The precision with which this technique measures a displacement, per pixel and in the most favourable theoretical case, is 0.41 millimetres, almost eighteen thousand times more. Measured on the real data it is 60 millimetres. Averaging over a large area lowers the threshold, but to reach 23 nanometres you would have to treat as a single pixel an area larger than the whole pyramid: it is no longer a tomography.
This is why the method works on ships, bridges, turbines and loaded dams, which move by millimetres, and not on a pyramid, which trembles too, but by nanometres.
What does work, and must be said
On the Mosul dam, which Biondi brings as proof, I mapped the motion over the whole area without telling the code where the power station is. Of the fifteen most moving blocks in the entire scene, five fall within 120 metres of the pumped-storage plant and five more near the main power station. Rotating machines do leave a trace in the first stage of the method, and that is in their favour.
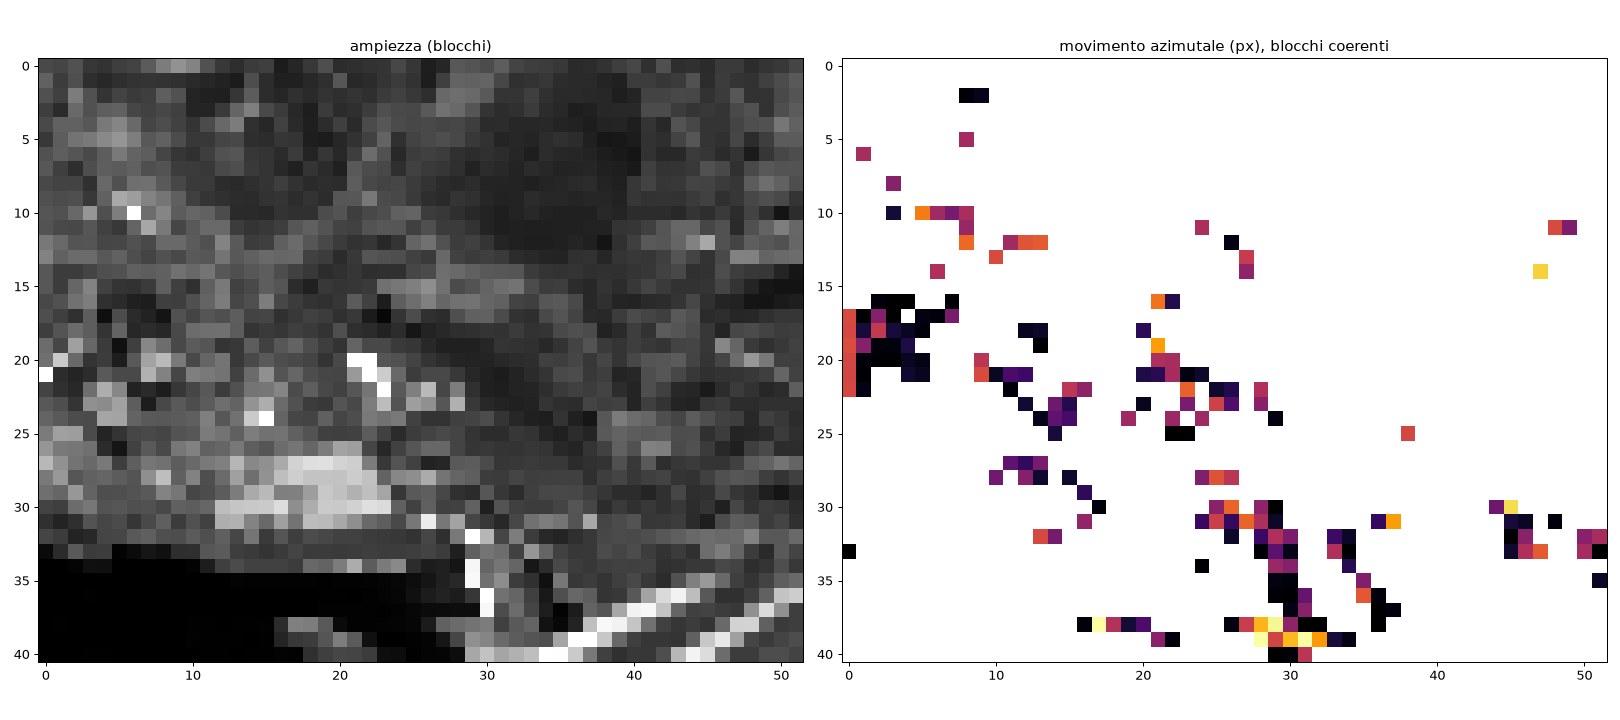
But the turbine signature in the raw data does not hold up: a 49 Hz peak under the power station, which is the grid frequency, disappears when the collect is split in two halves. And the gallery inside the dam, which they say they see at 300 metres, fails the same shuffle test as Giza: the dam body gives the same tomogram as the ground next to it, correlation 0.9995.
Their images and mine
From the modulus, as they describe, the computation gives vertical columns with horizontal bands at the same heights: the pattern of their Zeds. It comes out identical on the pyramid and on the sand, and the columns fall on the bright points of the radar image. The gallery inside the Mosul dam, which they say they see at 300 metres, also gives a tomogram identical to that of the ground next to it, correlation 0.9994.
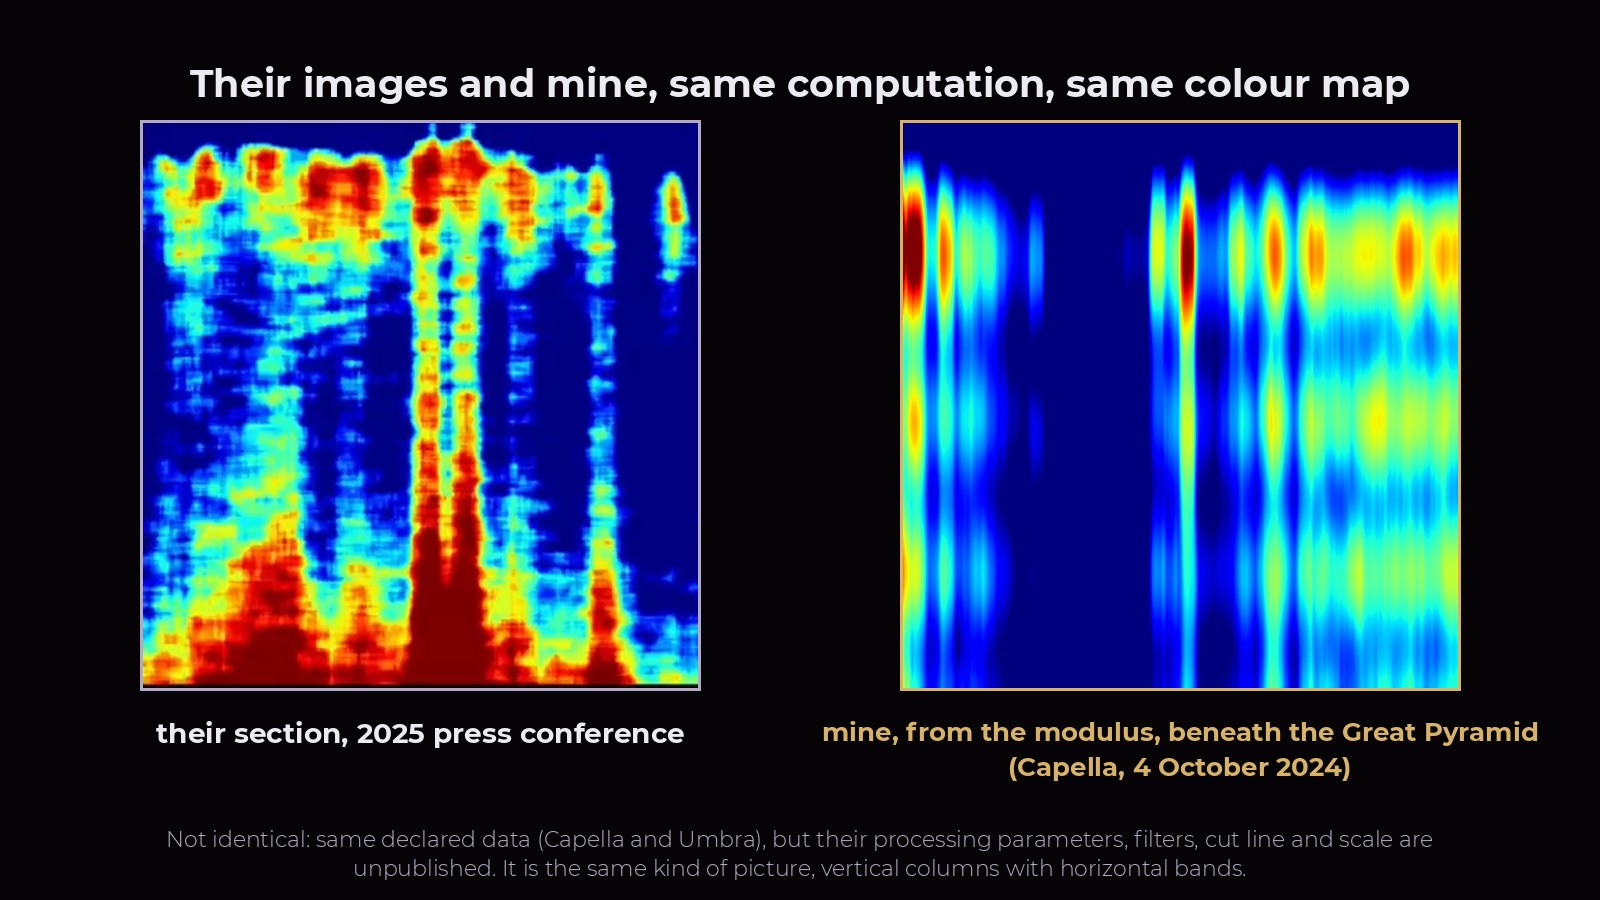
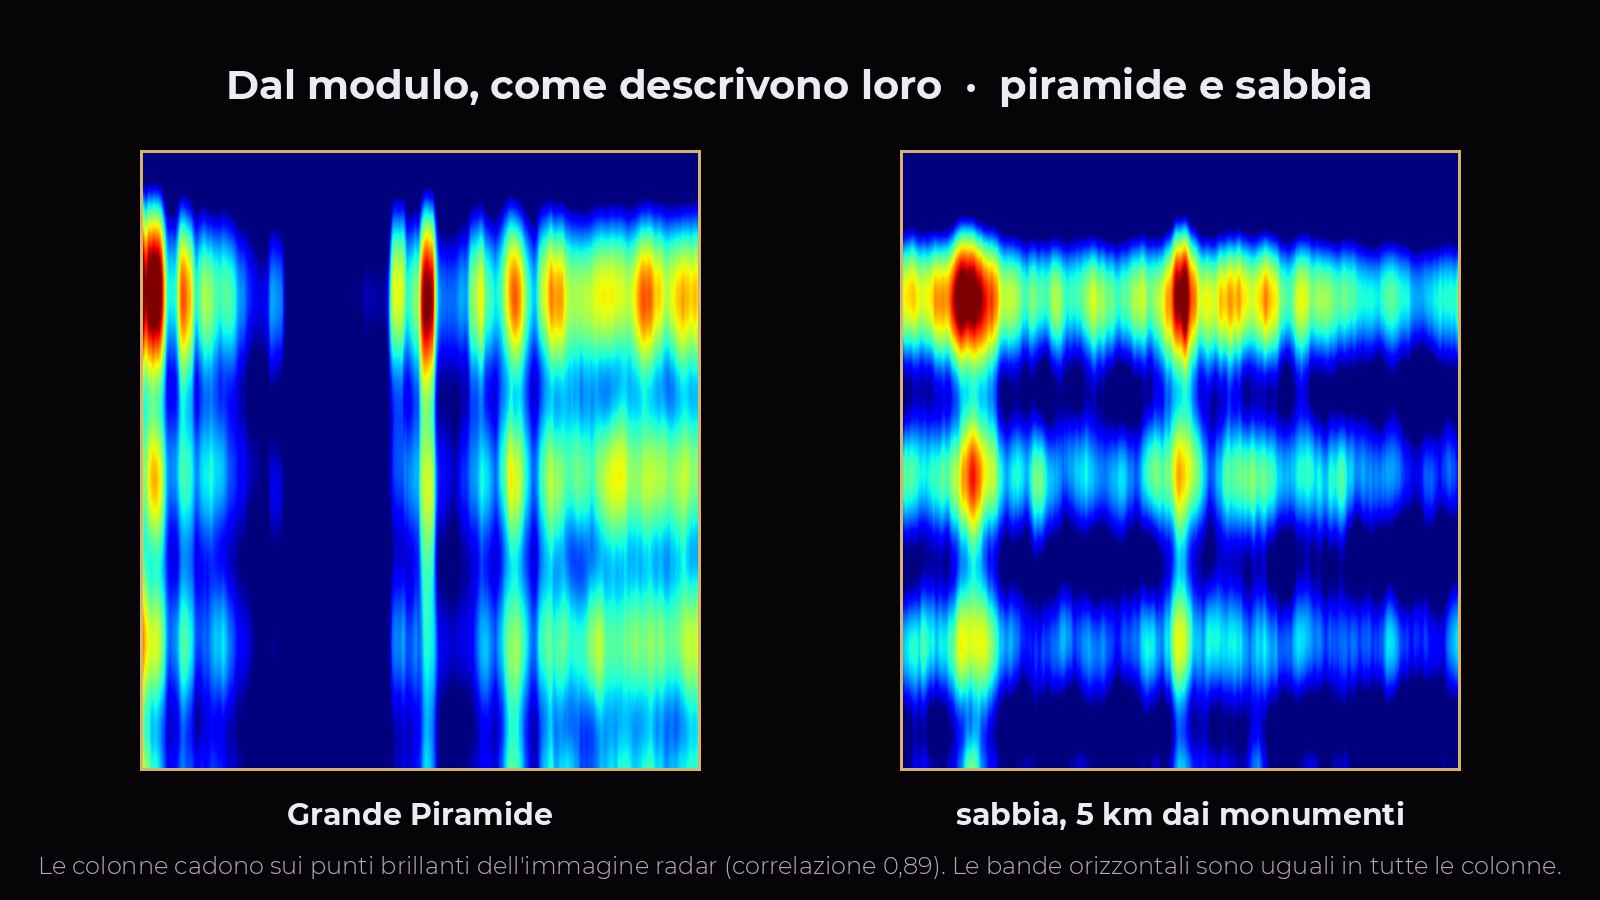
Two more details in their figures are explained by the computation rather than by architecture. The section shows the outer silhouette of the pyramid, a triangle with the apex at the top: a procedure that inherits the image geometry draws it, waves travelling down into the ground do not. And the columns they call Zed have equally spaced horizontal bands, identical at the same heights in two columns far apart: two real structures do not share the same layering to the millimetre, the transform of a spectrum that is identical in every pixel does.
Objections, and answers
The Capella scene is better than theirs: 33 seconds of integration against 15, five times the bandwidth. If the pattern were a structure, better data would show it better, not worse. And the shuffle test is paired, same pixels and same code: it does not depend on who took the picture.
The test that counts does not compare two programs. It takes the same data and the same program and changes one thing only, the order. If the pattern is still there after the order has been destroyed, it does not come from the ground, whatever program produces it. The code also passes a positive control: a known 1 mm vibration is recovered within fifteen percent.
I do not doubt it. The sand passes the same test, and so does the shuffled data.
The model used is already the high one. Even granting a thousand times more, one micron, you remain hundreds of times below the best threshold. And amplitude has nothing to do with the shuffle test, which fails regardless.
They cannot be checked: no open data exist for those two sites and the images are not published. What can be said is that they were tests on known targets, with the scale adjusted afterwards. The only near-blind check they had, the Big Void found by muons in 2017, the paper says on page 41 it did not detect.
True. Two lines earlier he said that for six months he feared the pillars were an artefact of the processing, and that he stopped doubting when other satellites gave the same pattern. The sand gives the same pattern.
The independent replication
So as not to rely on my code alone, I had everything redone by a second system, giving it only the paper, the three conferences, the Rogan interview, the statement and the 15 GB of data, with an explicit ban on reading my work. It reconstructed the method from the authors' own text, implemented it from scratch trying every variant and always keeping the one most favourable to them, designed its own controls and then ran mine as well. Its verdict, in its own words: "the method produces no information about the subsurface of Giza", high degree of certainty.
Three things it found that I had not.
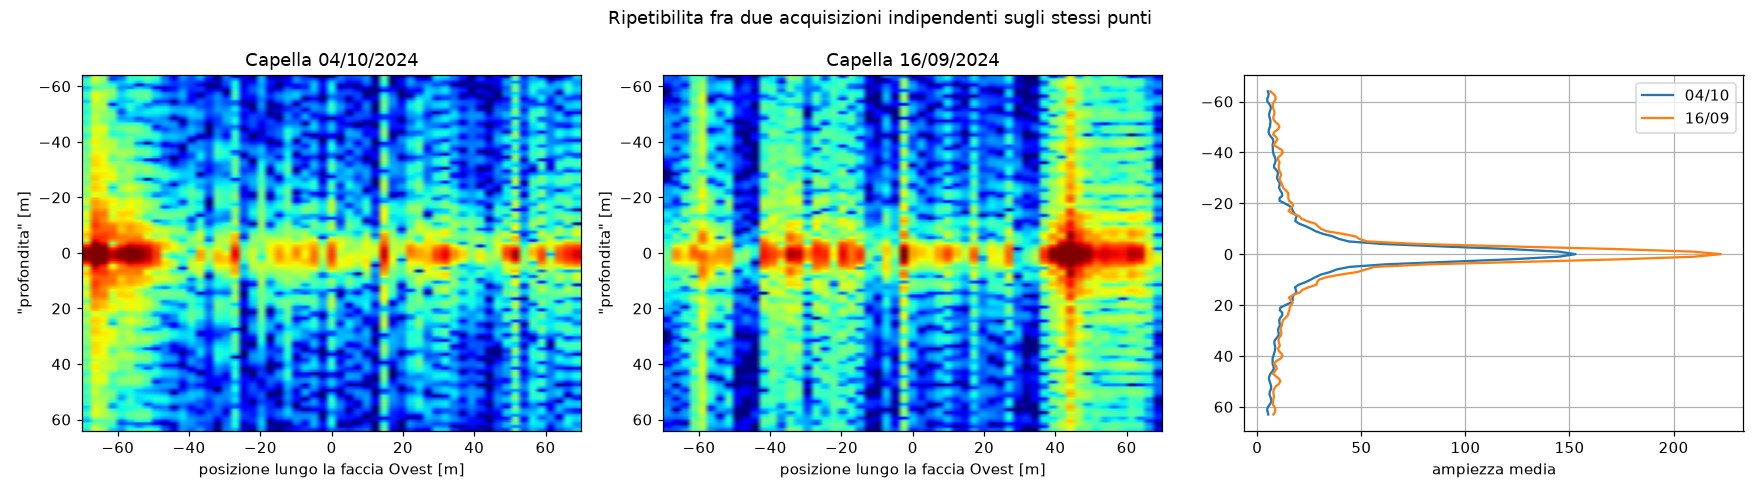
And the geometry, measured on the satellite's true orbit: in a single pass the available height resolution is 5.7 kilometres, not 0.92 metres. A target as tall as the pyramid is focused exactly at its layover position, with a residual of eight hundredths of a millimetre: height and ground distance are indistinguishable. The paper's formula treats the orbit track as a cross-track baseline and overestimates the sensitivity by a factor of about 860.
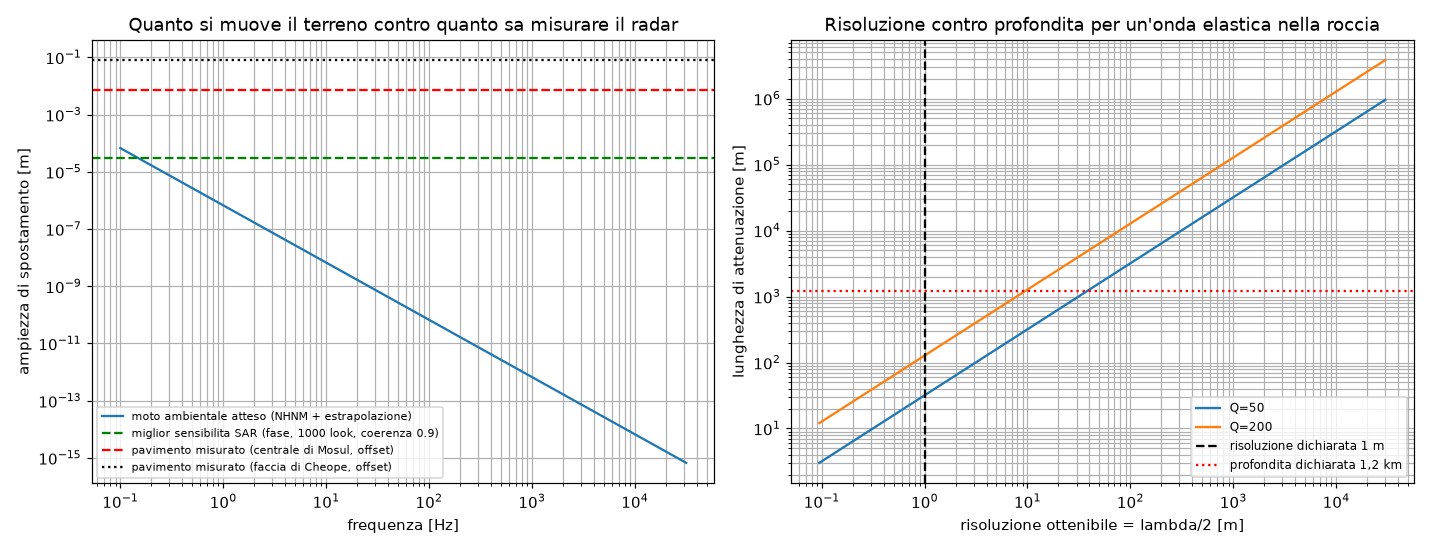
On the amplitude budget the two analyses use different assumptions: mine the 5-15 Hz band and a 0.41 mm threshold, a gap of 17,826; its own a table by frequency, with a gap from 16 times at 1 Hz up to 2.6 billion at 12,500 Hz. The conclusion is the same: at 1 Hz, where the gap is smallest, the wavelength is 4 kilometres and nothing is resolved; at the frequencies that would resolve a chamber the expected motion sits billions of times below the threshold. It too declares the same two things it does not have: the 2022 COSMO-SkyMed data and the authors' software.
What I could not verify
- The COSMO-SkyMed images of the 2022 paper: nobody has them, the paper lists them as not available.
- Gran Sasso and Gotthard: no open data, no published images.
- The exact parameters of their inversion: the paper does not report them, I had to reconstruct them. The shuffle test does not depend on them.
- Whether the Mosul turbines were running at 18:30 UTC on 8 August 2023.
What would save them
The underlying idea, that ambient noise carries information about the underground, is correct, and geophysics has used it for twenty years with seismometers placed on the ground. If two chambers 80 metres on a side sit 650 metres under Giza, each is missing over a billion kilograms of rock and the gravity field at the surface drops by about 18 microgal: modern instruments resolve one or two. A gravimetric survey of the plateau costs little and drills nothing. If the chambers are there, gravity sees them. And the shafts visible on the plateau can be mapped with a drone, as Malanga himself proposes.
My Volume 1
In the first volume of It Will Happen Again I cited the eight shafts and the two cubic chambers, relying on that paper. Given what I found, in the next printing I will present them as a hypothesis of Biondi and Malanga, stated as such. The cavities under the Sphinx and on the plateau remain: Thomas Dobecki and Robert Schoch measured them in 1992 with seismics, Waseda University in 1987, and Zahi Hawass went down into the tunnels himself. They do not depend on radar.
Data, code, report
Everything I used is public and everything I did can be repeated.
The code was written with the help of an AI and independently checked by a second one, which received only the paper, the conferences and the data, without seeing my code. If anyone redoes the maths and finds something else, I will write it here.
The files, one by one
All files sit in the public Capella Space and Umbra buckets (CC BY 4.0), downloadable without an account, e.g. with wget -c URL. To check you have the same file: sha256sum filename must give the fingerprint shown.
| File | Bytes | SHA-256 |
|---|---|---|
Capella, scene 4/10/2024, SLChttps://capella-open-data.s3.amazonaws.com/data/2024/10/4/CAPELLA_C13_SP_SLC_HH_20241004001939_20241004002012/CAPELLA_C13_SP_SLC_HH_20241004001939_20241004002012.tif |
3.644.348.054 | 9059f85c581ff9466a164c5f72894aa7fa840f334a7549abf139428d07fa1e88 |
Capella, scene 4/10/2024, metadatahttps://capella-open-data.s3.amazonaws.com/data/2024/10/4/CAPELLA_C13_SP_SLC_HH_20241004001939_20241004002012/CAPELLA_C13_SP_SLC_HH_20241004001939_20241004002012_extended.json |
170.763 | a878a0c1a23f6a4148d6fe64c365c8e470487c53b24bfe6023685876568f3598 |
Capella, scene 16/9/2024, SLChttps://capella-open-data.s3.amazonaws.com/data/2024/9/16/CAPELLA_C13_SP_SLC_HH_20240916215711_20240916215743/CAPELLA_C13_SP_SLC_HH_20240916215711_20240916215743.tif |
3.127.416.409 | b000b40004e63fee4239bfbe2393d811c4bab5a3f72518dcb89e2853e4b92851 |
Capella, scene 16/9/2024, metadatahttps://capella-open-data.s3.amazonaws.com/data/2024/9/16/CAPELLA_C13_SP_SLC_HH_20240916215711_20240916215743/CAPELLA_C13_SP_SLC_HH_20240916215711_20240916215743_extended.json |
166.814 | 1826640092384b7980e03f5fa30fe0d352517b7c655a0907f2e98ec7688d4a37 |
Umbra, Khufu 7/2/2023, image (SICD)https://umbra-open-data-catalog.s3.amazonaws.com/sar-data/tasks/ad%20hoc/Pyramids%20of%20Giza/7e7cd796-3842-4923-8b48-4c0950ece945/2023-02-07-07-58-27_UMBRA-05/2023-02-07-07-58-27_UMBRA-05_SICD.nitf |
242.922.921 | a0a54f0fbb91b97c2b1dda4ba4a795f5dbfecbd9dad9271ffe0c3af5088b8160 |
Umbra, Khufu 7/2/2023, raw data (CPHD)https://umbra-open-data-catalog.s3.amazonaws.com/sar-data/tasks/ad%20hoc/Pyramids%20of%20Giza/7e7cd796-3842-4923-8b48-4c0950ece945/2023-02-07-07-58-27_UMBRA-05/2023-02-07-07-58-27_UMBRA-05_CPHD.cphd |
435.296.400 | 7cf0faf6a83d6b38077fd9fbbfd0f0f257b30e25b20a00d353c05ef403b1225d |
Umbra, Khufu 8/2/2023, raw data (CPHD)https://umbra-open-data-catalog.s3.amazonaws.com/sar-data/tasks/ad%20hoc/Pyramids%20of%20Giza/44da7805-2129-4105-add8-2403bf671f40/2023-02-08-07-54-55_UMBRA-04/2023-02-08-07-54-55_UMBRA-04_CPHD.cphd |
519.921.744 | 1153c9b3aba6b697cd53e311189ef83c6aa4e7fb21d829ae66a46f6593c5eb56 |
Umbra, Khafre 8/3/2023, image (SICD)https://umbra-open-data-catalog.s3.amazonaws.com/sar-data/tasks/ad%20hoc/Pyramids%20of%20Giza/5aa49658-ecf9-4504-afee-281f43fb076e/2023-03-08-07-57-53_UMBRA-04/2023-03-08-07-57-53_UMBRA-04_SICD.nitf |
1.703.201.865 | 4aa372d7485c999e8a2155cacce942a6671f5c48ada068b003b62bfd1f8f89d4 |
Umbra, Mosul Dam 8/8/2023, image (SICD)https://umbra-open-data-catalog.s3.amazonaws.com/sar-data/tasks/ad%20hoc/Mosul%20Dam.%20Iraq/3504718f-16f9-44df-a04f-212074ce0918/2023-08-08-18-30-59_UMBRA-05/2023-08-08-18-30-59_UMBRA-05_SICD.nitf |
1.794.548.187 | f986fe9f3d33b99a822b7f57672505e0e20a386914a7a5e7d01717e0248320bf |
Umbra, Mosul Dam 8/8/2023, raw data (CPHD)https://umbra-open-data-catalog.s3.amazonaws.com/sar-data/tasks/ad%20hoc/Mosul%20Dam.%20Iraq/3504718f-16f9-44df-a04f-212074ce0918/2023-08-08-18-30-59_UMBRA-05/2023-08-08-18-30-59_UMBRA-05_CPHD.cphd |
3.368.753.832 | f481378148cd25c52e7fdf2e286fa36cb93aef847ae2ed582703cf6bd9db2e18 |
Capella catalogue: https://capella-open-data.s3.amazonaws.com/stac/catalog.json (2,286 SLC scenes; only these two contain the Giza plateau). Umbra catalogue: https://umbra-open-data-catalog.s3.amazonaws.com/ (folders sar-data/tasks/ad hoc/Pyramids of Giza e Mosul Dam, Iraq).
The calculations, one by one
Every number quoted on this page and in the video, with the formula and the values plugged in. Scripts are numbered as in the repository (e.g. "script 18").
1. Geolocation check (apex layover)
A point at height h above the base reaches the radar closer by h·cos(θ). With h = 138.7 m (current height of Khufu) and θ = 38.58°: 138.7·cos(38.58°) = 108.4 m of slant range. With 0.2498 m cells that is 434 cells. Measured with the file's RPCs: 432 cells. It matches.
2. Sampling: how many independent snapshots, what maximum frequency
Processed Doppler bandwidth B_D ≈ 0.8·V/δ_az = 0.8·7264/0.0450 = 129 kHz. Duration T = 32.869 s. For a sub-aperture to still be an image you need B_sub·T_sub ≥ 1, i.e. (B_D/N)·(T/N) ≥ 1, hence N_max = √(B_D·T) = √(129,023·32.869) = 2,059. Maximum observable frequency (Nyquist on the sub-aperture): f_max = N/(2T). With N = 24: 0.37 Hz. With N = 2,059: 31.3 Hz, and the azimuth resolution becomes δ_az·N = 92.7 m (the pyramid, 230 m, is 2.5 pixels wide). For Nyquist at 12,500 Hz you would need N = 2·12,500·T = 821,725 sub-apertures, each with 37.0 km of resolution. Absolute ceiling even without an image: PRF/2 = 5,097 Hz. 12,500 Hz is 2.45 times above it.
3. R/V amplification: why a micro-motion is visible at all
A radial velocity v_r shifts the Doppler centroid by 2v_r/λ and hence the azimuth position by Δx = v_r·R/V. For a vibration A·sin(2πft), v_r,max = 2πfA, peak-to-peak shift Δx_pp = 2·(2πfA)·(R/V). Here R/V = 754.21 km / 7,263.6 m/s = 103.8 s. With A = 1 mm and f = 0.2 Hz: Δx_pp = 2·(2π·0.2·0.001)·103.8 = 261 mm.
4. Attenuation of elastic waves in rock
A(dB) = 20·log10(e)·π·f·L/(Q·v) = 8.6859·π·f·L/(Q·v), with L the two-way path. Massive limestone (v = 4,000 m/s, Q = 100, L = 1,400 m): 10 Hz → 1.0 dB; 100 Hz → 9.6 dB; 1,000 Hz → 95.5 dB; 12,500 Hz → 1,193.8 dB. Intact granite, most favourable case (v = 6,000 m/s, Q = 1,000, L = 1,400 m): 10 Hz → 0.1 dB; 100 Hz → 0.6 dB; 1,000 Hz → 6.4 dB; 12,500 Hz → 79.6 dB. Half wavelength (resolution limit): λ/2 = v/(2f). At 10 Hz and 4,000 m/s: 200 m. At 12,500 Hz: 0.16 m. Where the wave comes back it does not resolve; where it would resolve it does not come back.
5. Amplitude budget
Ambient seismic noise, Peterson high-noise model (NHNM), 5-15 Hz band: displacement PSD ≈ 5.1·10⁻¹⁷ m²/Hz. RMS = √(PSD·Δf) = √(5.1·10⁻¹⁷·10) = 23 nm. Sub-pixel coregistration precision (standard formula): σ = √(3/(2N))·(1/π)·√((1-γ²)/(2γ²)) cells. With γ = 0.95 and N = 100 looks: σ = 0.0091 cells = 0.41 mm in azimuth. Gap: 0.41 mm / 23 nm = 17,826 times = 85 dB. Measured on real data (script 18): azimuth shift scatter on the most coherent targets 60.6 mm with 64 sub-apertures, 81 mm with 32.
6. The paper's depth formula, with their numbers and with others
δ_z = (v/f)·R/(2A) = (6000/12500)·650,000/84,000 = 3.71 m per bin → the "bottom of the shafts" (648 m with their numbers) is 648 m [theirs: granite] δ_z = (4000/12500)·650,000/84,000 = 2.48 m per bin → 432 m [limestone] δ_z = (2500/12500)·650,000/84,000 = 1.55 m per bin → 270 m [fractured limestone] δ_z = (1500/12500)·650,000/84,000 = 0.93 m per bin → 162 m [water] δ_z = (400/12500)·650,000/84,000 = 0.25 m per bin → 43 m [sand] δ_z = (4000/30)·650,000/84,000 = 1,031.75 m per bin → 180,000 m [limestone, f = 30 Hz]
7. Contrast and the shuffle test (from the modulus, as they describe)
The authors state their maps are "the representation of the modulus". For each pixel the vector Y is the series of the 31 sub-apertures; what is inverted is |Y| minus its mean (without removing the mean the constant component dominates everything with a band at z = 0). Contrast = maximum / median of the mean profile along z. Shuffle: random permutation of the sub-aperture order before inversion, 10 draws. Criterion declared beforehand: true contrast ≥ 3 × shuffled contrast.
Capella, Khufu 4/10: true 1.529, shuffled 1.192 ± 0.039, ratio 1.283. Khufu 16/9: ratio 1.314. Desert: true 1.331, shuffled 1.232, ratio 1.080. Umbra, Khufu: ratio 1.240; Umbra desert 1.025. Mosul: dam body 1.020, ground 1.012, natural hill to the east 1.259. Synthetic radar-noise-only scene: 1.000. Never 3, and the natural hill gives the same ratio as the pyramid.
Column positions, true vs shuffled: correlation 0.86 (Khufu), 0.93 (desert): the columns stay put because they come from image brightness; correlation between tomogram energy and radar brightness 0.89 on Khufu, 0.91 on the second scene.
Depth profiles: Khufu/desert 0.939 (Capella), 0.915 (Umbra); dam body/ground at Mosul 0.9994. Known chambers vs solid masonry: difference/scatter = 0.99 (needs to be well above 1). Kz sign inverted: identical profile, correlation 1.000, because with a real-valued input the transform is symmetric by construction, i.e. the axis cannot tell above from below.
Check with the phase (the version done first): ratio 1.008 on Khufu, 0.996 on the desert. Same conclusion, different pattern (blobs instead of columns).
8. The blue: correlation between tomogram and brightness
Modulus tomogram: energy E(x,y) = Σ_z |h(z;x,y)|. Pearson correlation between log10(E+1) and log10(radar amplitude+1) on the same pixels (812×400): +0.925. Same computation with the phase tomogram: -0.071.
9. Gravimetry: what a gravimeter would see
Empty cubic chamber 80 m on a side at 648 m: missing mass M = 80³·2,500 kg/m³ = 1.28·10⁹ kg. Surface anomaly g = G·M/r² = 6.674·10⁻¹¹·1.28·10⁹/688² = 1.8·10⁻⁷ m/s² = 18 microgal. A modern gravimeter resolves 1-5 microgal.
10. Radar power on the ground
S = P·duty·G/(4πR²) = 5000·0.10·10^(45/10)/(4π·650,000²) = 3.0 µW/m²; with 1 kW, 5%, 40 dB: 0.1 µW/m². The Sun: about 1,000 W/m², i.e. 10⁸ to 10¹⁰ times more.
Sources
- Biondi F., Malanga C., "Synthetic Aperture Radar Doppler Tomography Reveals Details of Undiscovered High-Resolution Internal Structure of the Great Pyramid of Giza", Remote Sensing 14(20), 5231, 2022. Retracted 10 August 2026 (Remote Sens. 2026, 18, 2679).
- Khafre Project, official statement of the 16 March 2025 conference.
- Public conferences: Spoleto, 27 July 2025; Castel San Pietro Terme, 21 June 2026. Joe Rogan Experience #2443, January 2026.
- Capella Space Open Data (CC BY 4.0); Umbra Open Data, folders "Pyramids of Giza" and "Mosul Dam, Iraq".
- Dobecki T.L., Schoch R.M., "Seismic Investigations in the Vicinity of the Great Sphinx of Giza, Egypt", Geoarchaeology 7(6), 1992.
- Peterson J., "Observations and Modeling of Seismic Background Noise", USGS Open-File Report 93-322, 1993.
- Zhu X., Bamler R., "Very High Resolution Spaceborne SAR Tomography in Urban Environment", IEEE TGRS 48(12), 2010.
- Luna J., independent replication of the method, github.com/not-JASH/sar-doppler-tomography, June 2026.
- Procureur S. et al., "Precise characterization of a corridor-shaped structure in Khufu's Pyramid by observation of cosmic-ray muons", Nature Communications 14, 1144, 2023.